Mapping Notification Cadence Shifts Against Signup Retention Curves in Promotion Ecosystems
Zara Klein · May 31, 2026
Mapping Notification Cadence Shifts Against Signup Retention Curves in Promotion Ecosystems
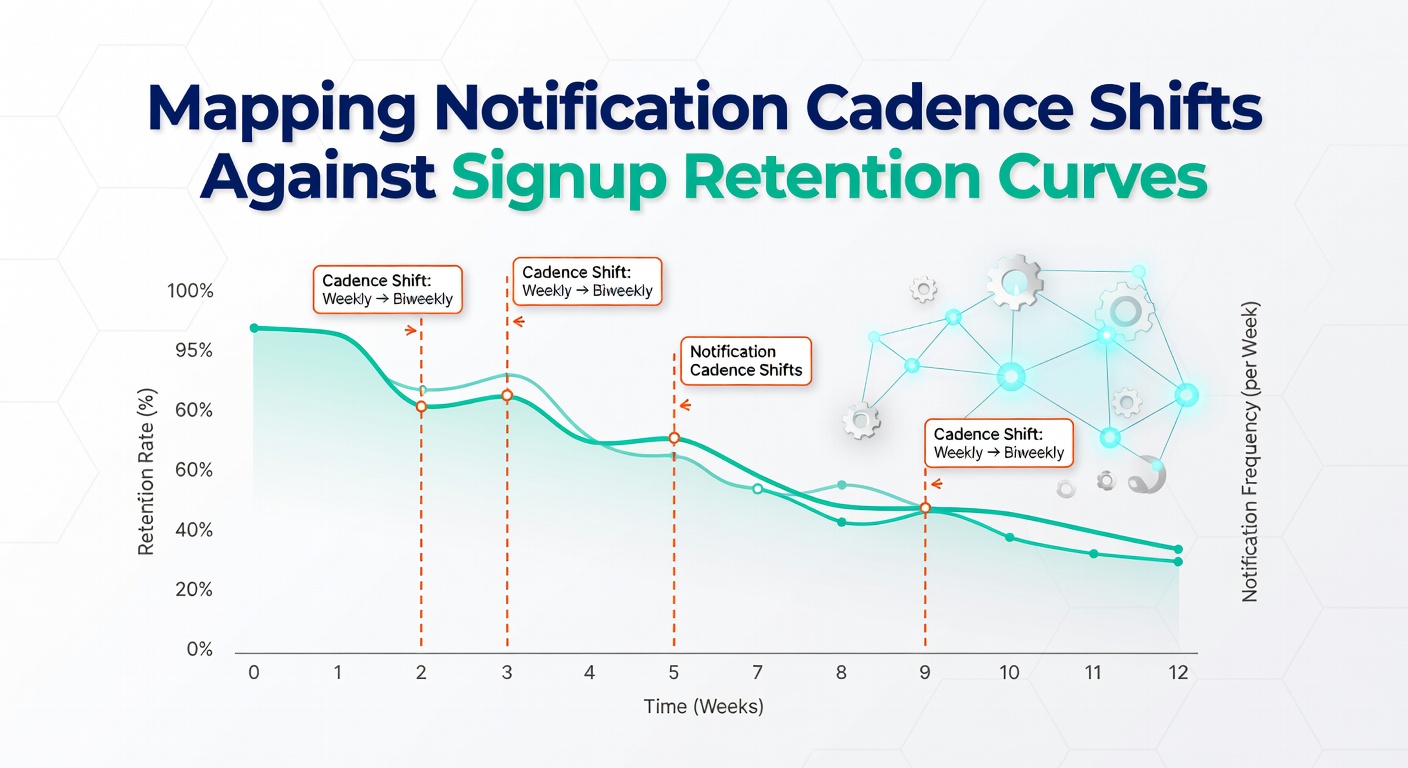
Promotion ecosystems rely on coordinated notification schedules to sustain participant engagement after initial signups occur. Analysts track how adjustments in message timing, frequency, and sequence align with retention curves that plot user activity over days, weeks, and months following registration. Data from multiple platforms indicate that early notification bursts often produce steep initial retention drops, whereas spaced intervals tend to flatten those curves in later stages.
Understanding Cadence Components in Promotional Systems
Notification cadence refers to the rhythm of alerts sent to new registrants, including reminders about upcoming draws, eligibility confirmations, and status updates. Retention curves capture the percentage of users who remain active at each interval after signup. Researchers at institutions such as the University of Melbourne have examined these patterns across consumer promotion datasets, noting that cadence changes directly influence drop-off points around the 7-day, 30-day, and 90-day marks. When platforms compress notification intervals in the first week, retention metrics frequently show accelerated early exits, while extensions beyond standard weekly sends correlate with steadier mid-term participation rates.
Data Mapping Techniques and Curve Analysis
Teams construct overlay maps by aligning timestamped notification logs with anonymized signup cohorts. This process reveals inflection points where retention begins to decline sharply or stabilize. According to findings published through the Federal Trade Commission consumer protection analyses, promotion operators in North America have documented how shifting from daily to every-other-day alerts reduces churn by measurable margins in recurring entry programs. These mappings also incorporate external variables such as seasonal campaign launches and regulatory announcement cycles that affect message delivery windows.
Software tools segment curves by demographic and geographic cohorts, allowing observers to isolate how notification density interacts with user location or age group. One study released by a Canadian research consortium in early 2025 highlighted that users in urban centers respond differently to accelerated cadences compared with rural participants, with the former group showing higher tolerance for frequent updates during the first 14 days post-registration.
Observed Shifts and Retention Outcomes Through 2026
Platform operators began testing variable cadence models more aggressively in late 2025, with several major promotion networks implementing adaptive schedules based on real-time retention signals. By May 2026, aggregated industry reports indicated that systems employing predictive mapping had adjusted notification triggers to coincide with predicted drop-off windows, producing flatter retention curves across multi-week campaigns. These adjustments often involved inserting mid-cycle status messages at points where historical data showed 15 to 20 percent activity declines.
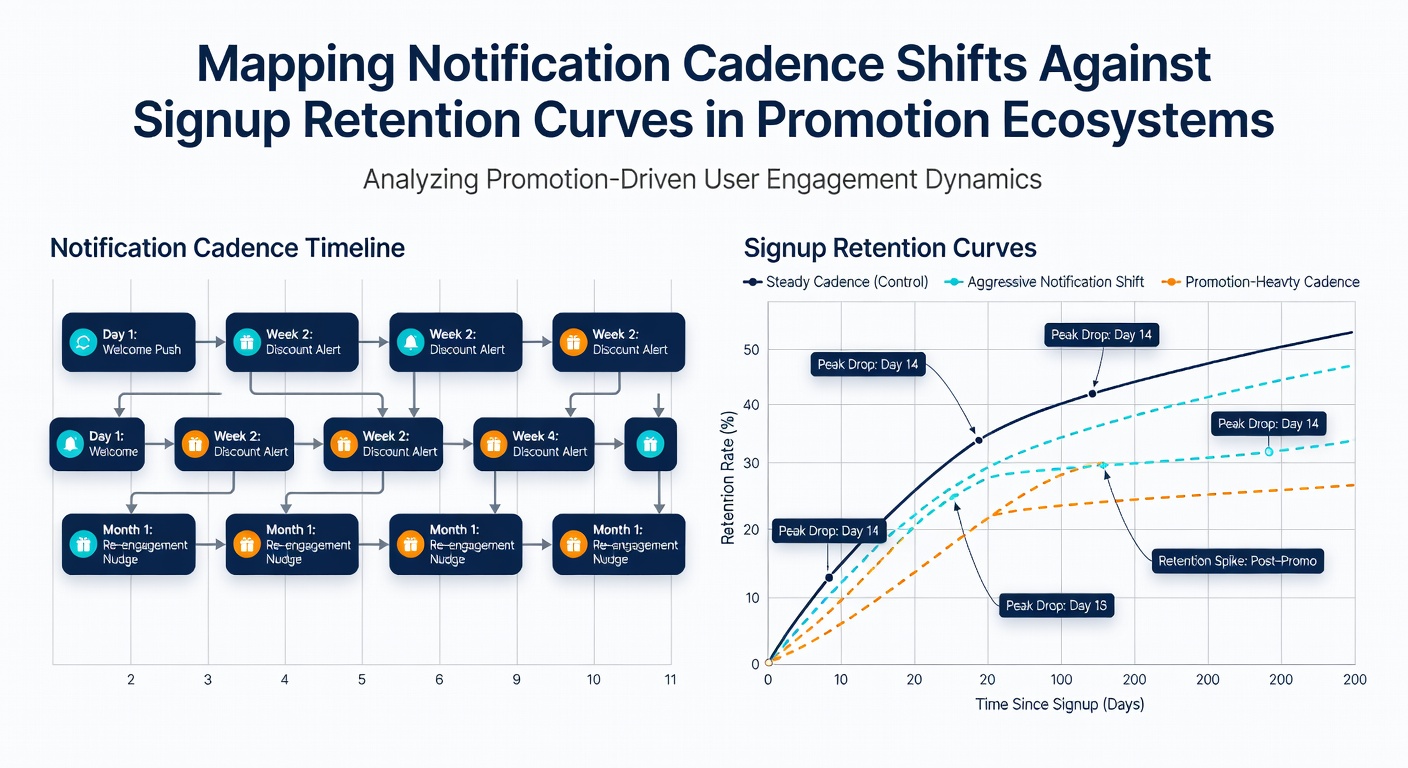
Cross-platform comparisons further demonstrate that synchronized cadence mapping across related promotions yields compounding retention benefits. When one ecosystem shares timing data with affiliated programs, participants encounter fewer redundant alerts, which in turn supports longer engagement spans. Figures compiled by the Australian Competition and Consumer Commission on consumer promotion disclosures show that transparent notification policies, paired with optimized delivery rhythms, correspond to sustained signup activity through quarterly cycles.
Integration With Broader Ecosystem Variables
Retention mapping does not occur in isolation. It intersects with eligibility rule changes, prize structure modifications, and device compatibility requirements that also influence user behavior. Observers note that when notification cadences align with these external factors, the resulting curves reflect smoother transitions rather than abrupt drops at rule-update points. For instance, campaigns that coordinate reminder sequences with periodic data-refresh prompts maintain higher qualification rates among long-term participants.
Academic examinations of promotion datasets have identified several recurring patterns. Cadence lengthening after the initial 48-hour period tends to preserve cohort sizes through the first month, while overly aggressive early messaging accelerates exits regardless of prize value. These observations hold across both daily-draw formats and longer-cycle giveaway structures.
Conclusion
Mapping notification cadence shifts against signup retention curves supplies promotion operators with actionable benchmarks for schedule refinement. The approach integrates timing data, cohort analysis, and external regulatory considerations into unified visual frameworks that highlight where interventions produce measurable stabilization effects. As platforms continue refining these overlays through 2026 and beyond, the relationship between message rhythm and participant persistence remains a central focus for sustained ecosystem performance.