Decoding Behavioral Tracking Metrics in Recurring Prize Promotions Through Platform Analytics
Zara Klein · Jul 9, 2026
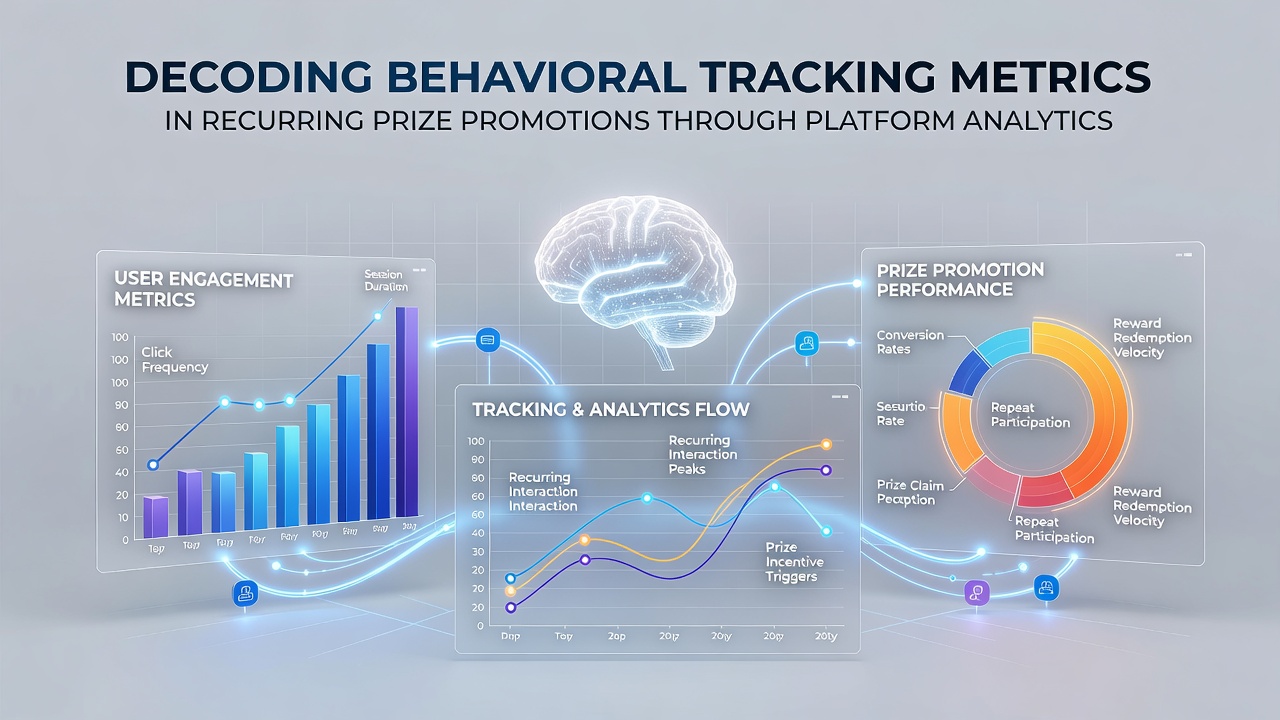
Decoding Behavioral Tracking Metrics in Recurring Prize Promotions Through Platform Analytics
Platform operators in recurring prize promotions rely on behavioral tracking metrics to interpret participant interactions across multiple entry cycles, and these metrics emerge from integrated analytics systems that log actions such as submission timestamps, device types, and session durations. Data aggregation occurs continuously because recurring formats generate repeated touchpoints that reveal patterns in participation volume and timing. Observers note that metrics like average entries per user and geographic distribution of logins provide measurable indicators of how audiences respond to scheduled draws. Analysts process these inputs through dashboards that segment users by activity clusters, and segmentation allows identification of high-frequency participants versus occasional entrants. Research from the Federal Trade Commission highlights compliance requirements for data handling in promotional activities, which influences how platforms structure their tracking protocols. Metrics extend beyond basic counts to include bounce rates on entry forms and completion percentages for multi-step registrations, while cross-referencing these figures with announcement schedules shows correlations between notification timing and subsequent engagement spikes.Core Metrics and Their Measurement
Behavioral metrics in this domain encompass entry velocity, which tracks the rate at which users submit participations within defined windows, and retention curves that plot return visits across weekly or monthly cycles. Platform analytics capture these through event logging that timestamps every interaction, enabling calculation of intervals between successive entries. Figures reveal that device compatibility data often correlates with participation consistency because users on mobile interfaces exhibit different session lengths compared to desktop sessions.
Time-based patterns surface when analytics overlay timezone data onto entry logs, and this overlay demonstrates how global participant pools distribute activity across peak hours. Another key indicator involves referral chain lengths, measured by tracking unique codes or links that connect new entrants to existing profiles. Studies indicate these chains influence overall volume because each successful referral multiplies exposure within networks of connected users.
Analytics Integration in Promotion Ecosystems
Integration begins with API connections between entry portals and backend databases, where raw logs feed into visualization tools that apply filters for demographic or behavioral variables. Experts have observed that combining entry data with clickstream analysis yields insights into form abandonment points, and these insights guide adjustments to registration flows without altering prize structures. In July 2026 platform updates are expected to incorporate enhanced machine learning layers that predict churn based on declining metric trends, such as reduced session frequency over successive campaigns.
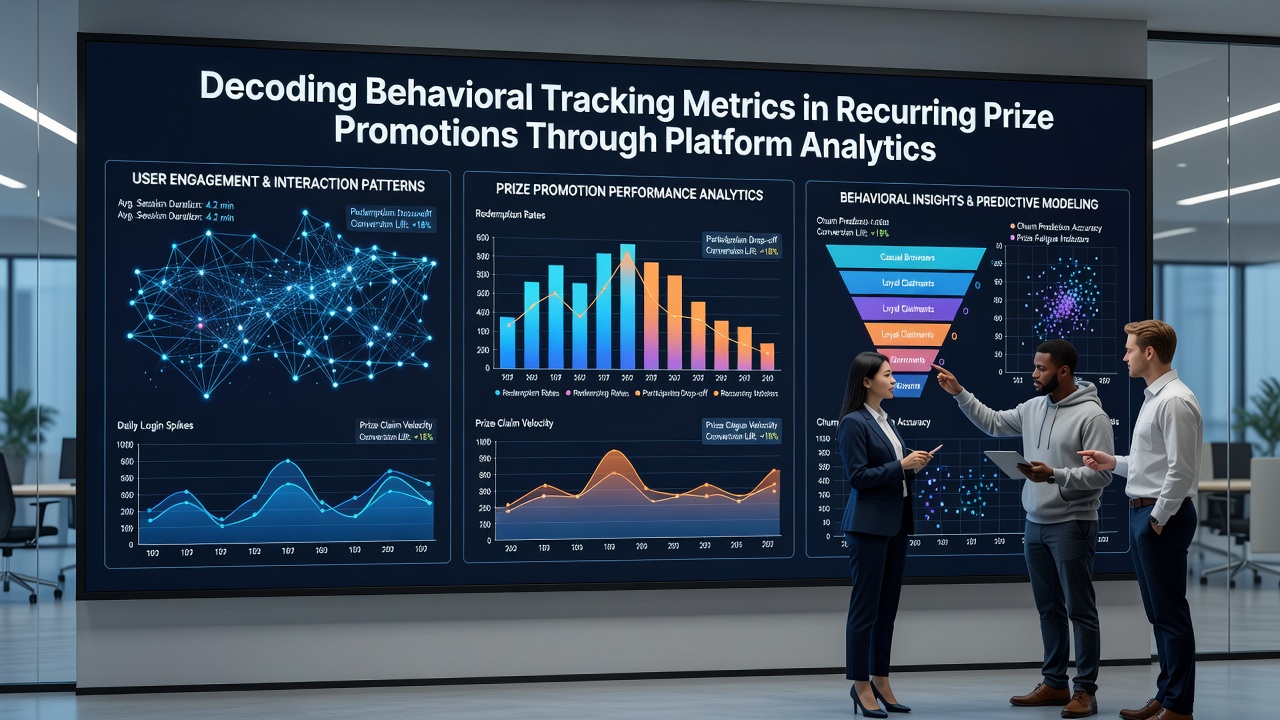
Correlation engines within the analytics stack compare profile update rates against sustained access levels, because incomplete data fields frequently trigger eligibility flags that reduce visible opportunities for participants. Reports from the Australian Competition and Consumer Commission outline transparency standards for promotional data practices, which encourage platforms to disclose metric collection methods in terms and conditions. Those disclosures in turn affect how users manage their activity profiles over extended periods.
Pattern Recognition Across Recurring Cycles
Pattern recognition algorithms scan historical datasets to flag anomalies such as sudden spikes in entries from specific regions, and anomaly detection supports fraud prevention by isolating coordinated activity that deviates from baseline distributions. Metrics also track cross-promotion migration, where participants shift between concurrent prize events on the same platform, revealing preferences for draw frequencies or prize categories. Evidence from academic research papers on consumer analytics demonstrates that sustained qualification standards correlate strongly with regular profile maintenance habits.
Notification cadence metrics measure open rates and click-throughs from winner announcements back to entry pages, and these rates help calibrate future messaging schedules. Platform operators apply clustering techniques to group users by similar behavioral signatures, which enables targeted adjustments to promotion parameters while maintaining compliance with eligibility rules across borders.
Conclusion
Platform analytics transform raw behavioral signals into actionable metrics that inform the structure and operation of recurring prize promotions, and continued refinement of these tools depends on accurate data pipelines that respect regulatory boundaries. Observers note that the interplay between entry patterns and announcement cycles produces measurable feedback loops that shape long-term participation dynamics across diverse user bases.